Should you trust AI visibility scores? What every platform measures — and what none of them tell you
PublishedJune 18, 2026 · Quratic Team · 13 min read
AI visibility scores are useful for trends inside one system — not as absolute truth across tools. Here is the measurement stack behind every score, and how to trust yours.
TL;DR
Trust AI visibility scores for trends inside one fixed measurement system. Do not trust them as absolute, comparable numbers across platforms.
A “42% visibility score” from Profound, Peec, Otterly, Ahrefs, HubSpot, or Quratic is not the same metric. Each platform combines different prompt sets, collection methods, engine weights, and formulas. Growth Engineer’s 14-day test found share-of-voice for the same brand on identical prompts differed by 12–22% across three leading tools.
What to trust: week-over-week and month-over-month direction on your own prompts, collected the same way, in the same country, on the same engines — with enough runs to absorb AI non-determinism.
What not to trust: comparing your score to a competitor’s score from a different tool, a one-off audit snapshot, or a single prompt run.
The angle almost no vendor discusses: visibility scores measure a stack of hidden choices (prompt universe × collection geography × metric definition × sample size × engine mix). Change any layer and the number changes — even if your brand did nothing.
Should you trust AI visibility scores? Conditionally yes — for internal trend tracking. Unconditionally no — as cross-platform benchmarks or single-run truth.
If your team uses one platform consistently, runs enough prompts on a schedule, assigns each prompt to the right country, and reads scores as rates over time rather than gospel percentages, the numbers are actionable. They tell you whether mention rate, share of voice, or citation rate is moving after a content sprint, PR push, or product launch.
If you treat a dashboard percentage like a credit score — portable across vendors, precise to the decimal, valid from one screenshot — you will make bad decisions. AI answers are non-deterministic by design: the same prompt can name different brands on consecutive runs. A single measurement is noise; a trend line is signal.
That distinction is the entire game in 2026. The sections below explain why scores diverge, what each major platform actually measures, how to evaluate any score including ours, and the dual-lens check almost no one runs to validate whether a number reflects reality.
Why “visibility score” is not one thing
Every platform publishes a headline number — visibility rate, share of voice, Aggregate Citation Score, Brand Visibility Index. Marketing teams assume these are comparable. They are not.
GenPicked’s 2026 methodology transparency guide frames the category correctly: there is no industry-wide audit standard for AEO/GEO measurement. Buyers must evaluate what is being measured, not which logo is on the dashboard.
At minimum, five layers sit beneath every score:
| Layer | What varies | Example impact |
|---|---|---|
| 1. Prompt universe | Which queries are tracked | Customer-defined prompts vs Profound’s real-user-derived prompts vs category-neutral industry indexes |
| 2. Collection method | How answers are fetched | Vendor API from a US datacenter vs browser session on a local residential IP |
| 3. Metric definition | How mentions become a score | Raw mention count vs Peec’s Bradley-Terry Aggregate Citation Score vs Profound’s prominence-weighted SOV |
| 4. Sample size | Runs per prompt per period | One run (noise) vs scheduled weekly runs (signal) |
| 5. Engine mix | Which AI platforms and weights | ChatGPT-only vs six engines with different buyer weights |
Change any one layer and the headline number moves — without your brand doing anything different on the web.
That is why Growth Engineer reported 12–22% SOV variance across Profound, Peec, and Otterly on identical prompt sets in a 14-day test. Profound’s weighted methodology scored lower than Peec for brands mentioned but not cited as sources. Otterly’s unweighted mention frequency scored highest. All three were “correct” under their own definitions.
Practical rule: pick one stack, document it, track trends. Never merge numbers from two vendors in one chart.
Layer 1: Prompt universe bias
Not all prompts are equal — and not all platforms choose them the same way.
Customer-defined prompts (Quratic, Otterly, most self-serve tools): you write 20–30 queries representing your category. The score measures visibility on your hypothesis of what buyers ask. Miss an intent cluster and your score can look strong while you are invisible on high-volume queries you never tracked.
Real-user-derived prompts (Profound Index methodology): built from semantic search across hundreds of millions of real conversations, filtered to brand-agnostic category questions. Measures observed demand, not assumed demand. Better for industry benchmarks; different from your custom prompt library.
Free audit prompts (Ahrefs AI checker, HubSpot AI Search Grader): fixed batch, often brand-name-heavy. Useful for a one-time snapshot; not comparable to ongoing category prompt tracking.
Trust signal: Ask any vendor: “Who chose these prompts — us, you, or your index?” A score without a documented prompt policy is measuring an undisclosed universe.
Layer 2: Collection geography — the hidden variable
This layer is under-discussed and disproportionately affects teams in Asia.
Perplexity, Google AI Mode, and ChatGPT browse-enabled answers change by IP location and interface context. A visibility score collected from a US datacenter is not a proxy for what a buyer in Singapore, Tokyo, or Jakarta sees. We documented this gap with a concrete fintech example: US API collection surfaced global neobanks; Singapore browser collection surfaced MAS-licensed local players.
| Collection type | Typical location | What it measures |
|---|---|---|
| Vendor API | US/EU datacenter | Sanitized, often generic answer |
| Browser + residential IP | Target country | What a local user likely sees |
| Manual spot-check | Whatever VPN you use | Inconsistent, not trendable |
Trust signal: Every score should be tagged with country and collection method. If it is not, assume US-default and discount applicability to Asian markets.
Quratic’s visibility rate is explicitly per prompt country via browser collection on residential IPs in SG, JP, KR, MY, ID, and HK. That is a feature, not a universal standard — Peec also emphasises UI scraping; Profound emphasises scale and real prompt volume. The point is not “ours is best.” It is: know which geography your number describes.
Layer 3: Metric definition — mention, citation, position, sentiment
Platforms use the same words for different math.
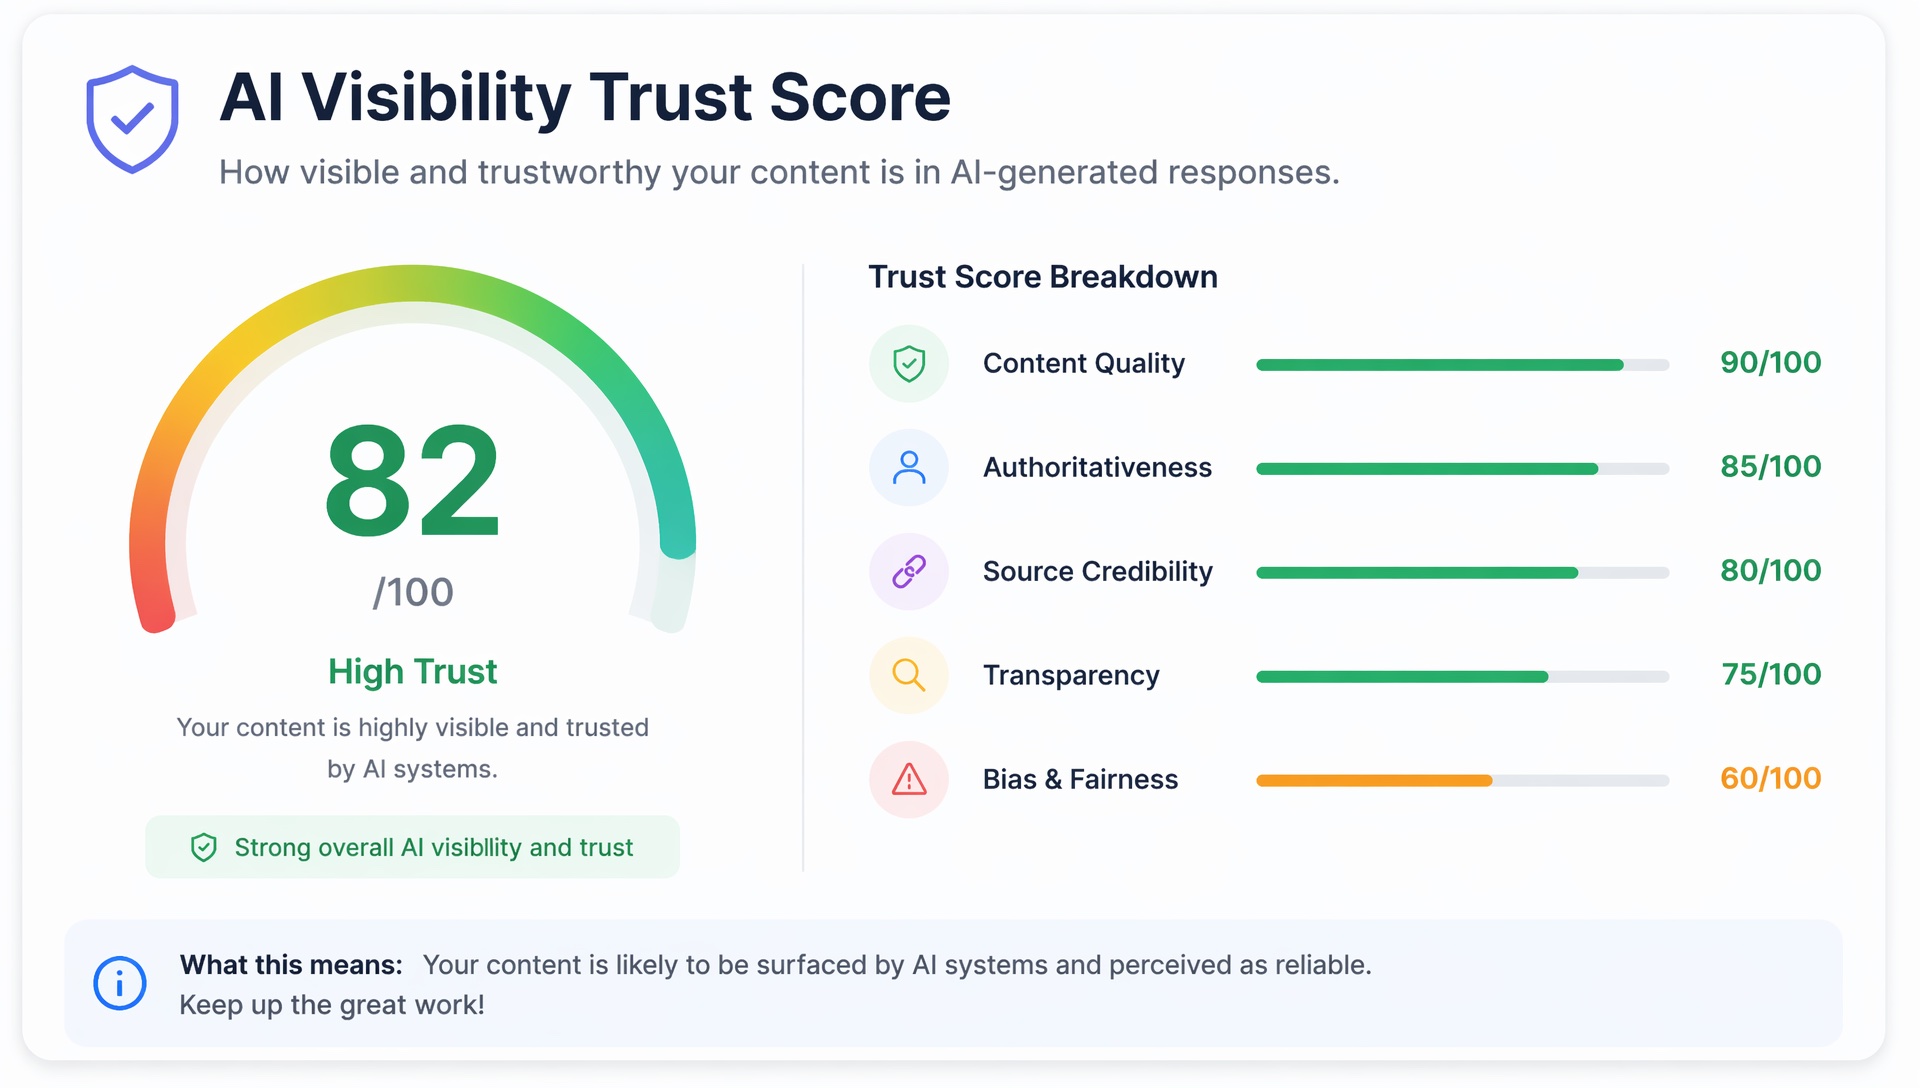
Quratic defines visibility rate as:
Percentage of AI responses in the selected period that mention your brand by name.
Formula: (runs where brand_mentioned = true) ÷ (total completed runs) × 100.
We also track separately: citation rate (responses linking to your domain), average position when listed, sentiment score, and share of voice vs tracked competitors. Mention ≠ citation. Perplexity tends to link sources; ChatGPT often names brands without URLs.
Peec AI publishes an Aggregate Citation Score using Bradley-Terry modelling with engine weights (ChatGPT 35%, Claude 25%, Gemini 25%, Perplexity 15%) — a calibrated ranking, not a simple mention percentage.
Profound weights share of voice by prompt volume and citation prominence — brands mentioned in passing score lower than brands cited as sources.
Otterly reports raw mention frequency without prominence weighting — highest headline numbers, least nuance.
Trust signal: Request the formula. “Visibility” without definition is marketing copy. Acceptable answers include mention rate, weighted SOV, or citation probability — each valid, none interchangeable.
Layer 4: Non-determinism — why one run is noise
AI answer engines are stochastic systems. Identical prompts produce different responses because of sampling at generation time and variable retrieval on live-web platforms.
Evidence:
- An arXiv paper on generative search measurement (2026) argues citation visibility metrics are sample estimators of an underlying distribution, not fixed values — single-run point estimates carry unquantified uncertainty.
- Visiblie states the honest unit of measurement is a rate across repeated queries, not yes/no from one screenshot.
- AirOps research found less than 10% of the same content gets cited after five consecutive runs of the same prompt — single spot-checks are statistically weak.
- Passionfruit’s 11.2M citation analysis found 68% of queries that generated citations in one month did not generate them the next month.
Trust signal: Prefer platforms with scheduled repeated collection over one-off audits. Treat weekly or bi-weekly cadence as minimum for trend detection. Aysa.ai recommends confidence intervals over single numbers — polling logic applied to AI visibility.
A Quratic visibility rate of 34% means: “In this period, your brand was mentioned in 34% of completed runs for these prompts, in this country, on these models, collected this way.” It does not mean “34% of all buyers in your category see you.”
Layer 5: Engine mix and composite weighting
Your score depends on which AI platforms are included.
Peec publishes explicit engine weights. Profound tracks 10+ engines including Grok, DeepSeek, and Meta AI. Free tools often check ChatGPT only.
A “visibility score” dominated by ChatGPT will understate Perplexity citation dynamics and overstate brands strong in OpenAI’s retrieval layer. Platform behaviour diverges materially — ranking #1 on Google does not predict Perplexity citations.
Trust signal: Segment scores by engine, not only as a composite. Leadership decks should show ChatGPT, Perplexity, and Google AI Mode separately before averaging mentally.
Platform-by-platform: what each score actually is
| Platform | Headline metric | Collection | Best use of score |
|---|---|---|---|
| Quratic | Mention rate, SOV, citation rate, sentiment | Browser + residential IP, per country | Trend tracking in Asian markets; dual-lens with Google rank |
| Profound | Weighted visibility / SOV | Enterprise infrastructure; real prompt volume data | Enterprise category benchmarks; prompt demand sizing |
| Peec AI | Visibility + ACS (Bradley-Terry) | UI scraping | Cross-brand calibrated ranking within a prompt set |
| Otterly | Raw mention frequency | Multi-engine monitoring | Simple alert-style mention tracking |
| Ahrefs / HubSpot (free) | One-time brand scan | Fixed audit batch | Baseline snapshot only |
| Passionfruit Index | Category citation benchmarks | Large-scale research dataset | Industry comparisons, not account-level ops |
None of these numbers should appear on the same axis in a board deck without a footnote explaining the stack.
The dual-lens check no one runs (Quratic’s unique validation)
Here is the trust test almost no platform article covers: corroborate AI visibility against Google rank on the same intent.
AI mention rate and organic rank measure different layers — but for many category queries they should move together over time if your content strategy is working. When they persistently diverge, one score is misleading you about where the failure sits.
| AI visibility | Google organic rank | Likely diagnosis |
|---|---|---|
| High | High | Strong — defend quadrant |
| High | Low | AI cites third-party sources about you; fix SEO/on-site |
| Low | High | Classic SERP loss — rank without AI Overview or answer mention |
| Low | Low | Urgent gap on both layers |
Quratic is built to run this check in one project: Rankings (localized Google organic position, AI Overview ownership, SERP features) alongside AI Visibility (prompt mention rate, citations, SOV) — same keywords and intents, same country, same device split.
If your AI visibility score rises but Google rank and AI Overview citation stay flat, you may be winning in ChatGPT while losing the Google SERP buyers still use. If Google rank improves but AI mention rate stays flat, your SEO worked but GEO content structure or third-party citations did not. Trust either score alone and you optimize the wrong layer.
This dual-lens corroboration is the strongest trust signal available in 2026 — stronger than any vendor’s proprietary index.
Five questions to ask before trusting any score
Adapted from GenPicked’s buyer checklist and our own methodology:
- Which prompts are tracked — and who chose them?
- From which country and IP type are answers collected?
- What is the exact formula for “visibility”? (mention rate vs weighted SOV vs composite index)
- How many runs per prompt per period? (single vs scheduled)
- Can I see raw answers, not only aggregated scores?
If a vendor cannot answer all five, treat the headline number as directional marketing — not measurement.
How to use scores responsibly
Do:
- Track trend direction over 4–8 weeks minimum
- Segment by country, engine, and prompt category (branded / category / comparison)
- Pair AI scores with Google rank on matching intents
- Report ranges and sample size (“34% over 48 runs” not “34%”)
- Re-baseline after major prompt library changes
Do not:
- Compare your Otterly score to a competitor’s Profound score
- Panic over a single-week drop (68% monthly citation churn is normal)
- Treat free audit scores as equivalent to continuous monitoring
- Average APAC markets into one number
- Present visibility rate to the board without stating collection geography
FAQ
Is Quratic’s visibility score more trustworthy than competitors?
It is more transparent for Asian market collection — browser-based, country-assigned, with separate mention/citation/position metrics and dual-lens Google rank in the same project. It is not more “accurate” in an absolute sense because accuracy requires a defined prompt universe, and no vendor shares the same universe. Trust ours for trends on your prompts in SG, JP, KR, MY, ID, HK — not as a universal industry index.
Can two platforms both be right if they show different scores?
Yes. 12–22% SOV variance on identical prompts across three tools proves this. Different formulas, different weights, different definitions — all internally consistent.
How many prompts do I need before a score is reliable?
Minimum 15–20 category prompts per market for directional signal; fewer than five active prompts triggers low-sample warnings in most serious workflows. Combine with weekly cadence for 4+ weeks before reporting to leadership.
Should I trust free AI visibility checkers?
For a baseline snapshot, yes — Ahrefs and HubSpot’s grader are useful starting points. For ongoing decisions, no — they lack country-level collection, competitor SOV trends, and repeated sampling.
What is a “good” visibility score?
On category prompts, 15–25% mention rate is a reasonable “good” range; 30%+ indicates strong performance. But the number only matters relative to your own baseline and competitors tracked the same way — not as an absolute grade.
Does a high visibility score mean more revenue?
Not directly. AI referral traffic remains ~0.1–1% of total site traffic for most sites today — but Discovered Labs notes AI-sourced traffic can convert at higher intent. Visibility scores measure consideration-set presence, which precedes clicks.
Bottom line: Trust AI visibility scores the way you trust polling data — useful for trends when methodology is fixed, sample is adequate, and geography matches your buyer. Distrust them the way you distrust comparing two polls that used different questions, different sample sizes, and different weighting models.
Run your first baseline with documented methodology — browser collection, country-assigned prompts, and Google rank on the same intents in one dashboard.